 "New rural index shows early signs of recovery from drought-driven slump")
India’s rural growth appears to be picking up. It’s hard to overstate the importance of the rural economy -- its ups and downs determine broader growth and hold the key to political stability. Tracking rural activity though, is challenging given the dearth of data. The closest proxy --quarterly agricultural growth -- is released with a lag of two months. To fill this gap, Bloomberg Economics has created an India Rural Output Index -- a composite monthly gauge consisting of supply- and demand-side indicators that goes beyond agriculture to get a comprehensive view on the rural economy.
The latest signals are encouraging -- pointing to a turnaround from a drought-driven slump in 2014 and 2015 and shock from demonetisation in 2016. Normal rainfall in 2016 and 2017 helped revive activity, and the outlook for another year of good rains bodes well for 2018. In this note, we introduce the rural tracker in detail.
Rural Tracker Shows Early Signs of Recovery
Over the last few years and in the budget proposal for fiscal 2019, the government has put a greater focus on empowering farmers and rural households. Among the measures are free cooking gas cylinders, fast tracking the goal of connecting all villages to the electricity grid, agriculture marketing reforms, farm insurance subsidies, and higher support prices for agricultural produce. All of these bode well for the outlook of the rural economy.
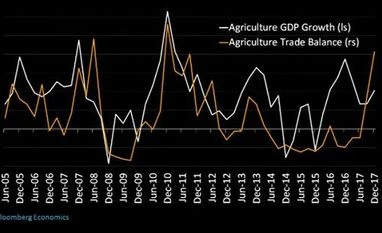
Rural Tracker Correlates Well With Agriculture GDP
Rural output growth and its components
Agriculture-focused components:
• Amount of rainfall: The Southern Oscillation Index, published by the Australian Weather Bureau, is the best proxy for tracking rainfall and consequently agriculture production in India. A sustained value of -7 or lower indicates a likely El-Nino event (drought in India), a sustained value of +7 or higher indicates a La-Nina event (surplus rainfall in India), and a reading in between indicates normal rainfall in India. The value is currently at -1.2, and the latest outlook issued by the bureau suggests normal rainfall during the 2018 monsoon season from June to September. The correlation with agriculture GDP varies over time in a range of 0.5 to 0.7.
Favorable Rainfall Revives the Rural Economy
• Agriculture trade balance: This variable uses detailed data on imports and exports, and aggregates the items under the agriculture and allied products group to compute the agricultural trade balance. During the drought years of 2014 and 2015, India’s import requirements increased, causing the trade balance to deteriorate. Record production over the last two years though, is boosting exports. The correlation between the agriculture trade balance and agriculture GDP varies in a range of 0.3-0.6.
Higher Agriculture Production Improves Trade Balance
Rising Tractor Sales a Positive for Agriculture Productivity
• Real rural wage growth: This consumption proxy averages nominal rural wages for agricultural and non-agricultural occupations. This is deflated using inflation faced by rural labourers. Wage growth remained robust during demonetisation likely due to the good harvest increasing demand for labour. In the absence of demonetisation, wage growth could have been higher. Data on nominal wage growth is available with a lag of more than three months. For timeliness, we assume nominal wage growth remains unchanged from the last available value.
• Two-wheeler sales: This is another proxy for rural consumption. More than 50% of all two-wheeler sales are made in rural areas, according to industry sources. Sales were hit in the wake of demonetisation but have picked up in recent months.
Demonetisation - a speed bump for rural recovery
• Government rural expenditure: Government rural expenditure is constructed as the sum of central government expenditure made through key rural ministries -- the Ministry of Rural Development, Ministry of Agriculture and the Ministry of Tribal Affairs. As it tends to be lumpy, year-on-year growth tends to be highly volatile. The data available since April 2012 show a slowdown following demonetisation, and more recently a rising trend.
Government Expenditure Picking Up Again Post demonetisation
To read the full story, Subscribe Now at just Rs 249 a month
Already a subscriber? Log in
Subscribe To BS Premium
MONTHLY₹9/day
₹249
Renews automatically
SMART ANNUAL₹5/day
₹1699₹1999
Opt for auto renewal and save Rs. 300 Renews automatically
ANNUAL₹6/day
₹1999
What you get on BS Premium?
-
 Unlock 30+ premium stories daily hand-picked by our editors, across devices on browser and app.
 -
 Pick your 5 favourite companies, get a daily email with all news updates on them.
 '%3E%3Cg id='Artboard-Copy' transform='translate(0 0.012)'%3E%3Cg id='_126115' transform='translate(0 0)'%3E%3Cpath id='Path' d='M17.537 1.487a.473.473 0 0 0-.467.477v12.67A2.4 2.4 0 0 1 14.7 17.06H3.3A2.4 2.4 0 0 1 .933 14.634V.966H14.587v12.29a.467.467 0 0 0 .933 0V.489a.473.473 0 0 0-.467-.477H.467A.473.473 0 0 0 0 .489V14.63a3.346 3.346 0 0 0 3.3 3.382H14.7A3.346 3.346 0 0 0 18 14.63V1.965a.467.467 0 0 0-.462-.478Z' transform='translate(0 -0.012)' fill='%23c4132a'%3E%3C/path%3E%3Cpath id='Path-2' d='M12.676 3.955a.478.478 0 1 0 0-.955H2.508a.478.478 0 1 0 0 .955Z' transform='translate(0.124 0.166)' fill='%23c4132a'%3E%3C/path%3E%3Cpath id='Path-3' d='M12.676 13H2.508a.478.478 0 1 0 0 .955H12.672a.478.478 0 1 0 0-.955Z' transform='translate(0.124 0.768)' fill='%23c4132a'%3E%3C/path%3E%3Cpath id='Shape' d='M2 6v5.371a.484.484 0 0 0 .467.5H7.531a.484.484 0 0 0 .467-.5V6a.484.484 0 0 0-.467-.5H2.467A.484.484 0 0 0 2 6Zm.933.5H7.066v4.375H2.933Z' transform='translate(0.122 0.317)' fill='%23c4132a'%3E%3C/path%3E%3Cpath id='Path-4' d='M12.321 5.5H8.967a.478.478 0 1 0 0 .955h3.354a.478.478 0 1 0 0-.955Z' transform='translate(0.517 0.317)' fill='%23c4132a'%3E%3C/path%3E%3Cpath id='Path-5' d='M12.321 8H8.967a.478.478 0 1 0 0 .955h3.354a.478.478 0 1 0 0-.955Z' transform='translate(0.517 0.467)' fill='%23c4132a'%3E%3C/path%3E%3Cpath id='Path-6' d='M12.788 10.977a.473.473 0 0 0-.467-.477H8.967a.478.478 0 1 0 0 .955h3.354a.471.471 0 0 0 .467-.478Z' transform='translate(0.517 0.617)' fill='%23c4132a'%3E%3C/path%3E%3C/g%3E%3C/g%3E%3C/g%3E%3C/svg%3E) Full access to our intuitive epaper - clip, save, share articles from any device; newspaper archives from 2006.
Full access to our intuitive epaper - clip, save, share articles from any device; newspaper archives from 2006. Preferential invites to Business Standard events.
 Curated newsletters on markets, personal finance, policy & politics, start-ups, technology, and more.
Need More Information - write to us at assist@bsmail.in