 "Retail visits show a pickup, and other weekly economic indicator insights")
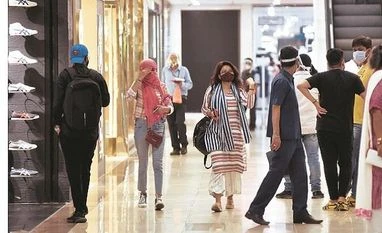
More people are visiting retail and recreation spots even as India’s total Covid-19 cases crossed the three million mark.
Increased traffic in key cities are also among indicators pointing to people stepping out of their homes as the economic cost of the lockdown forced the government to gradually reduce restrictions. Business Standard tracks power generation, pollution and railway freight numbers on a weekly basis; in addition to traffic and Google’s mobility reports on visits to retail and other spots. Google’s reports come with a lag, all other data is as of 23rd August. The usual economic indicators like trade numbers and gross domestic product appear monthly or quarterly. Analysts globally have been tracking such indicators to keep an eye on the fast-changing situation on the ground.
Search engine Google uses location data to track visits to key categories of places. The visits are back to levels seen in late March. They are still down by over half from the times before the pandemic hit the world and caused governments to shut down in a bid to stop its spread. Visits to other categories of places show marginal changes. Workplace visits are around 70 per cent of normal (see chart 1).
Traffic is another indicator which showed that more people are moving out. Location technology firm TomTom International data shows a rise in traffic congestion in both Mumbai and New Delhi. Mumbai traffic is at 58 per cent of 2019 levels. New Delhi traffic is 88 per cent of 2019 numbers (see chart 2).
The difference in vehicular movement also reflects in pollution data. Business Standard tracks nitrogen dioxide levels. Emissions are the outcome of industrial activity; vehicles are another source. Mumbai’s nitrogen dioxide levels as measured by Bandra locality numbers is still 86 per cent lower than 2019. Delhi numbers are only down 13 per cent (see chart 3).
The railways are carrying more goods than they did in the same week last year. The previous week had shown bigger gains. The quantity of goods carried was up almost 10 per cent year on year for the week ending August 16, compared to around 1.3 per cent for the current week. Earnings from the goods carried showed a decline (see chart 4).
Power generation shows signs of a marginal decline. The seven-day rolling average had been more than 2019 levels for most of August. It has slipped to slightly below the 2019 levels in the last few days (see chart 5).
To read the full story, Subscribe Now at just Rs 249 a month
Already a subscriber? Log in
Subscribe To BS Premium
MONTHLY₹9/day
₹249
Renews automatically
SMART ANNUAL₹5/day
₹1699₹1999
Opt for auto renewal and save Rs. 300 Renews automatically
ANNUAL₹6/day
₹1999
What you get on BS Premium?
-
 Unlock 30+ premium stories daily hand-picked by our editors, across devices on browser and app.
 -
 Pick your 5 favourite companies, get a daily email with all news updates on them.
 '%3E%3Cg id='Artboard-Copy' transform='translate(0 0.012)'%3E%3Cg id='_126115' transform='translate(0 0)'%3E%3Cpath id='Path' d='M17.537 1.487a.473.473 0 0 0-.467.477v12.67A2.4 2.4 0 0 1 14.7 17.06H3.3A2.4 2.4 0 0 1 .933 14.634V.966H14.587v12.29a.467.467 0 0 0 .933 0V.489a.473.473 0 0 0-.467-.477H.467A.473.473 0 0 0 0 .489V14.63a3.346 3.346 0 0 0 3.3 3.382H14.7A3.346 3.346 0 0 0 18 14.63V1.965a.467.467 0 0 0-.462-.478Z' transform='translate(0 -0.012)' fill='%23c4132a'%3E%3C/path%3E%3Cpath id='Path-2' d='M12.676 3.955a.478.478 0 1 0 0-.955H2.508a.478.478 0 1 0 0 .955Z' transform='translate(0.124 0.166)' fill='%23c4132a'%3E%3C/path%3E%3Cpath id='Path-3' d='M12.676 13H2.508a.478.478 0 1 0 0 .955H12.672a.478.478 0 1 0 0-.955Z' transform='translate(0.124 0.768)' fill='%23c4132a'%3E%3C/path%3E%3Cpath id='Shape' d='M2 6v5.371a.484.484 0 0 0 .467.5H7.531a.484.484 0 0 0 .467-.5V6a.484.484 0 0 0-.467-.5H2.467A.484.484 0 0 0 2 6Zm.933.5H7.066v4.375H2.933Z' transform='translate(0.122 0.317)' fill='%23c4132a'%3E%3C/path%3E%3Cpath id='Path-4' d='M12.321 5.5H8.967a.478.478 0 1 0 0 .955h3.354a.478.478 0 1 0 0-.955Z' transform='translate(0.517 0.317)' fill='%23c4132a'%3E%3C/path%3E%3Cpath id='Path-5' d='M12.321 8H8.967a.478.478 0 1 0 0 .955h3.354a.478.478 0 1 0 0-.955Z' transform='translate(0.517 0.467)' fill='%23c4132a'%3E%3C/path%3E%3Cpath id='Path-6' d='M12.788 10.977a.473.473 0 0 0-.467-.477H8.967a.478.478 0 1 0 0 .955h3.354a.471.471 0 0 0 .467-.478Z' transform='translate(0.517 0.617)' fill='%23c4132a'%3E%3C/path%3E%3C/g%3E%3C/g%3E%3C/g%3E%3C/svg%3E) Full access to our intuitive epaper - clip, save, share articles from any device; newspaper archives from 2006.
Full access to our intuitive epaper - clip, save, share articles from any device; newspaper archives from 2006. Preferential invites to Business Standard events.
 Curated newsletters on markets, personal finance, policy & politics, start-ups, technology, and more.
Need More Information - write to us at assist@bsmail.in