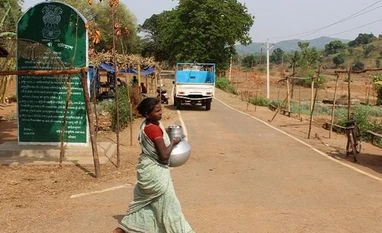
The poorest states by this measure were Andhra Pradesh, Jharkhand and Bihar, with Andhra--which ranks 15 among 29 Indian states by per capita income--reporting a monthly surplus of Rs 95, 1/15th the national average and enough to buy only a litre of refined oil.
Drawn from the All India Rural Financial Inclusion Survey 2016-17 (NAFIS), released in August 2018 by the National Bank for Agriculture and Rural Development (NABARD), these data reveal enduring poverty in farm families, disparities between states and confirm growing inequality in India (documented here and here).
The average monthly consumption expenditure of rural Indian households--agricultural and non-agricultural--was Rs 6,646 in 2015-16 (agricultural year between July 1, 2015-June 30, 2016), compared to the average monthly income of Rs 8,059. That leaves Rs 1,413, the monthly surplus we referred to.
The average debt per indebted rural household in 2013 was Rs 103,000--almost equal to the price of a Royal Enfield Bullet 350--IndiaSpend reported on January 4, 2018, indicating the gulf in urban and rural areas, where 833 million or 68.8% of Indians live, most of them poor.
NAFIS, launched in 2016-17, covered 245 districts in 29 states including 40,327 households in tier-3 to tier-6 cities (population less than 50,000) “to get a holistic view of the rural financial landscape”, the report said.
While average monthly expenditure for all households in rural India was Rs 6,646, agricultural households--that is, households that received produce in excess of Rs 5,000 from agricultural activities--reported 15% more expenses compared to non-agricultural households (Rs 6,187).
Households in Punjab and Kerala have highest expenses
The average monthly consumption expenditure per household of Punjab (Rs 11,707) was the highest in India, nearly twice the national average of Rs 6,646, followed by Kerala (Rs 11,156).
Households in West Bengal, Jharkhand, Chhattisgarh, Odisha, Madhya Pradesh, Andhra Pradesh, Uttar Pradesh and Bihar reported lower consumption than the national average.
The median monthly per capita expenditure for Indian farm households was Rs 1,375, indicating that 50% of the households reported a monthly expense of less than Rs 1,375 per person per month, according to the report.
Source: NABARD All India Rural Financial Inclusion Survey 2016-17
The surplus in Andhra Pradesh (Rs 95)--cost of a litre of refined oil--was the least in the country, nearly 1/15th the national average of Rs 1,413.
Agricultural households with less than 0.01 hectares (ha)--less than a quarter of a football field--had an average monthly income of Rs 8,136, which was nearly half of those with land more than 2 ha.
“With an exception of households in the size class of less than 0.01 ha of land, the income surplus for households goes on increasing with the increase in the size of land possessed showing a sharp increase in the last size class of more than 2 hectares,“ the report said.
“Incomes vary based on factors such as the nature of irrigation and the type of crop,” Madhura Swaminathan, economist and chairperson of the MS Swaminathan Research Foundation, told IndiaSpend in an interview on September 16, 2018. “In our research, we found that in all villages nearly 20%-30% of small farmers, in some cases nearly 50%, made losses or negative incomes.”
Richest spend six times as much as than poorest
In agricultural households, the richest households spent six times as much as the poorest.
The average monthly consumption of households varied based on the decile class (poorest households are at one and the richest at 10 on a scale of 1-10). Of all households in rural India, consumption of households in the highest decile class, or richest, were 6.5 times higher than the lowest while their income was 20 times that of the lowest class.
Source: NABARD All India Rural Financial Inclusion Survey 2016-17
“Considering all households combined, the consumption expenditure of the households in the second decile was about 1.5 times that of the first decile, and that for the tenth decile was also roughly 1.5 times that of the 9th decile,” the report said. “This phenomenon was common for both agricultural and non-agricultural households and is reflective of the wide disparity in the status of the poorest as compared to the richest households.”
Agricultural households with more than 2 hectare (ha)--equivalent to nearly three football fields--of land spend 52% of the monthly expenditure on non-food items compared to 46% among those who owned less than 0.01 ha of land.
The richest households spent 54% of their income on non-food items while the poorest households’ spending on the same was nine percentage points less, showing that the poor spent most of the income on food.
(Paliath is an analyst with IndiaSpend.)
Reprinted with special permission from IndiaSpend.org
To read the full story, Subscribe Now at just Rs 249 a month
Already a subscriber? Log in
Subscribe To BS Premium
₹249
Renews automatically
₹1699₹1999
Opt for auto renewal and save Rs. 300 Renews automatically
₹1999
What you get on BS Premium?
-
Unlock 30+ premium stories daily hand-picked by our editors, across devices on browser and app.
-
Pick your 5 favourite companies, get a daily email with all news updates on them.
Full access to our intuitive epaper - clip, save, share articles from any device; newspaper archives from 2006.
Preferential invites to Business Standard events.
Curated newsletters on markets, personal finance, policy & politics, start-ups, technology, and more.
Need More Information - write to us at assist@bsmail.in
)