As Table 1 shows, the past two weeks have seen a sharp fall in the global price of oil - as well as of its competing energy source, natural gas. Even the price of liquefied petroleum gas in Japan has seen a comparable fall. Whether this is sustainable is still in doubt - almost all the changes this year to date have happened in this period.
As Table 2 shows, oil seems to have permanently left the sub-$40 a barrel band - only the financial crisis slowed its rise to a steady $110-120 a barrel.
In any case, in spite of geopolitical concerns in West Asia, oil production from the OPEC cartel has remained steady, as Table 3 shows.
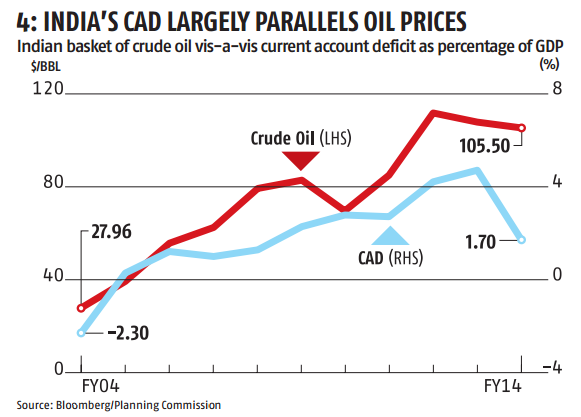
For India, oil prices matter a great deal. As Table 4 shows, the current account deficit (CAD) over the past 10 years has largely paralleled the price of oil. But it is clear that the market hopes the reduction in oil prices is permanent - and that it will spur reform of oil pricing.
Oil marketing companies, in Table 5, have seen a distinct jump in their share prices in response to this hope.
Upstream oil prices, in Table 6, have seen a much smaller bump, a more steady increase over the year.
P-E ratios for the companies are clustered just under 16, as Table 7 shows.
)