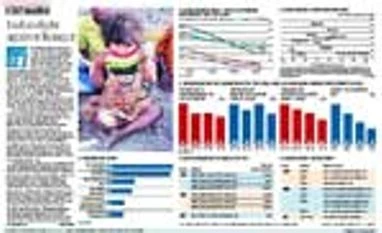
The latest edition of the Global Hunger Index (GHI), brought out by the International Food Policy Research Institute (IFPRI), has shown that India has slid further down the rankings. The country is now pegged at 97 out of 118 countries. Last year, India was ranked 80th out of 104 countries. However, as Chart 1 shows, it is not the case that India has not improved on nutritional parameters — the score has registered a secular improvement over the years. In a ranking, though, it matters a lot how others have performed. For instance, Myanmar has registered a far greater improvement than India, despite starting from a worse condition in 1992. Pakistan is an example of the exact reverse.
In this regard, Chart 2 shows how efficient India has been in reducing hunger and malnutrition. The Y-axis maps the percentage reduction in GHI since 2000. Rwanda, Ethiopia and even Afghanistan have registered more impressive improvements. Chart 3 shows where India succeeded — reductions in under-five years child mortality and under-five years child stunting been the key drivers — and where it has struggled — wasting in under-five years children has been a stubborn problem to address. Chart 4 shows the regional distribution of hunger and malnutrition. South Asia and Africa South of the Sahara are by far the most distressed areas.
In India’s context, researchers at IFPRI have also pointed widespread data inconsistencies. As Chart 5 shows, while India has conducted several different types of surveys on health and nutrition, there is no set frequency for data collection. Similarly, as shown in Chart 6, when it comes to the target respondents, there is no consistency. One survey collects data among women aged between 13 and 49 years, while the next one targets women aged 15 to 49 years. Similarly, one targets “all women” in the age bracket, while other targets only “married women” and yet another targets “currently married” women. As such, notwithstanding the numerous surveys undertaken by public and private organisation, it is difficult to compare the results as the nutrition data suffers from a lack of standardisation.
)