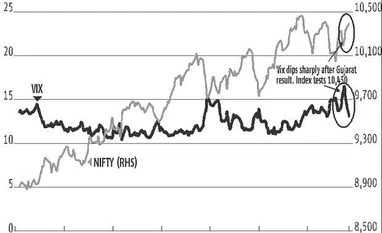
A highly volatile session on Monday saw the Nifty swing through 350-points before it settled strongly up as the Gujarat election verdict came through. The Nifty hit a low of 10,074 points in the morning before it tested 10,443 on the upside, before finally settling just below 10,400.
The most likely pattern now is range trading again between 10,100 and 10,450. There are signs that the intermediate downtrend marked through the past few weeks is over. There is also a relatively small chance that we’ll see a new all-time high soon.
The rebound from 10,074 set up a pattern of higher troughs compared to the prior low of 10,030 that signals an end to the intermediate downtrend. The level to watch now would be the all-time high of 10,490. If that's beaten, there would be strong upside momentum. However, the pessimists could note that the relief rally ran into heavy selling above 10,400.
Leaving relief aside for the moment, this result changes nothing fundamentally. Economic recovery continues to look weak with higher inflation, a rising current account deficit, a weak industrial recovery and continuing goods and services tax (GST) glitches.
FPIs have been sellers in December. Their selling has been more than matched by domestic institutional buying. Retail sentiment was poor but may recover on the election results. The narrow Bharatiya Janata Party victory might also have been discounted by this one big session.
Traders remain braced for currency volatility with key central bank policy reviews on the agenda. Brexit draws closer and the pound is under pressure with the Bank of England due for a review. The Federal Reserve has hiked the US policy rate as expected and also set a schedule for deleveraging its balance sheet. The Bank of Japan might just hike its policy rates or taper its QE.
The long-term trend remains bullish. The short-term trend is up, going by Monday. The intermediate trend is tentatively, up. The market would need to break above 10,490 to break out to a new high. Trend following signals suggest buying with a stop at 10,275. The VIX has stabilised at lower levels after spiking sharply.
This bounce started from support at 9675-9700. The 200-Day Moving Average is around 9,750. In the longer-term, the Nifty moved North in December 2016 from 7,900 levels to a high of 10,490 in early November 2017. The Index has bounced twice from 9,675 since December 2016.
The Nifty Bank rebounded less emphatically than the Nifty. The "Bank" is currently at 25,600 after falling from 25,953 and bouncing from 24,620. A strangle of long December 28, 26,000c (84), long December 28, 25,000p (81) costs 165. This position is biased to the upside. But, one side or another is very likely to be hit, if there's two big sessions.
A trader could take this and sell short December 21, 26,000c (36), short December 21, 25,000p (32) to reduce net costs to 97, if the short strangle expires without being hit. This net long-short position could give a big payoff if the financial index stays volatile. Two big trending sessions would take the long strangle into the money.
The Nifty's Put-Call Ratios is in neutral territory. The Nifty closed at 10389 on Monday. A bullspread of long December 10,400c (83), short 10,500c (40) costs 43 and pays a maximum 57 and it's just 10 points from money. A bearspread of long 10,300p (47), short 10,200p (30) costs 17, pays a maximum of 83 and is 90 points from money.
A long 10,400c (79), 10,400p (83) has breakevens at 10,562, 10,238. A wider long 10,500c (40), long 10,300p (47) costs 87 and it has breakevens at 10,213, 10,587. This needs a 2 per cent move in either direction. This is quite likely to happen within the settlement.
Unlock 30+ premium stories daily hand-picked by our editors, across devices on browser and app.
Pick your 5 favourite companies, get a daily email with all news updates on them.
Full access to our intuitive epaper - clip, save, share articles from any device; newspaper archives from 2006.
Preferential invites to Business Standard events.
Curated newsletters on markets, personal finance, policy & politics, start-ups, technology, and more.
)