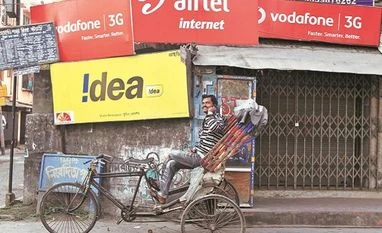
Both Airtel and Vodafone Idea, according to reports, are planning to file petitions for reviewing the Supreme Court's recent order after the Department of Telecom (DOT) told them to approach the court in this regard. Any review petition is required to be filed by November 24 as there is a time limit of a month to file for reviewing a court order. READ MORE HERE
Here's a look at how key telecom stocks look on technical charts:
S&P BSE Telecom: The index saw a gap-down opening on Thursday and traded near the last reversal level of 870 levels. The overall trend was weak as the index recently failed to sustain above 200-day moving average (DMA). Going forward, this gap down has dampened the upside potential and if the index does not manage to close above 900-mark today, then this may amplify the selling pressure resulting in lower levels of 840 and 820 levels. The relative strength Index (RSI) is trading at 38 value and this may enter oversold territory in the coming sessions, if the index fails to give strong close at the end of the day. CLICK HERE FOR THE CHART
Bharti Airtel Ltd (BHARTIARTL): The overall trend remains positive as the price has been rising with the "higher high, higher lows" formation. It opened gap down today and till it trades above Rs 350, the upside bias is still favourable. The major move is expected above Rs 385, which is a trend line resistance as per the daily chart. Although, RSI and Moving Average Convergence Divergence (MACD) are trading with negative bias; however, Rs 350 remains a firm support. CLICK HERE FOR THE CHART
ALSO READ: If Vodafone actually quits, India will be the bigger loser
Vodafone Idea Ltd (IDEA): After the breakdown of “Death Cross” pattern, the counter has not showed any strong reversal. The current price of the stock is below Rs 10 - the psychological barrier for entering a stock trading. Hence, the counter needs to cross minimum Rs 5.10, to regain the upside momentum, as shown by 50-DMA. CLICK HERE FOR THE CHART
Mahanagar Telephone Nigam Ltd (MTNL): The counter has seen a continuous "gap up" close in the last 16 sessions. On the weekly chart, the stock has witnessed “Double Bottom” formation with a breakout. All these indicate a positive trend and the upside is certain as per the daily chart. The Moving Average Convergence Divergence (MACD) is heading towards the signal line, which suggests higher levels of Rs 14 and Rs 18. CLICK HERE FOR THE CHART
OnMobile Global Limited (ONMOBILE): Except the “Golden Cross” pattern on the daily chart, rest of the indicators such as RSI, MACD, and price are showing a negative bias. The 100-DMA stands at Rs 31.15, which seems to be the immediate support. A major move is expected when the counter closes above Rs 40 - this level saw selling pressure in last two months. CLICK HERE FOR THE CHART
To read the full story, Subscribe Now at just Rs 249 a month
Already a subscriber? Log in
Subscribe To BS Premium
₹249
Renews automatically
₹1699₹1999
Opt for auto renewal and save Rs. 300 Renews automatically
₹1999
What you get on BS Premium?
-
Unlock 30+ premium stories daily hand-picked by our editors, across devices on browser and app.
-
Pick your 5 favourite companies, get a daily email with all news updates on them.
Full access to our intuitive epaper - clip, save, share articles from any device; newspaper archives from 2006.
Preferential invites to Business Standard events.
Curated newsletters on markets, personal finance, policy & politics, start-ups, technology, and more.
Need More Information - write to us at assist@bsmail.in
)