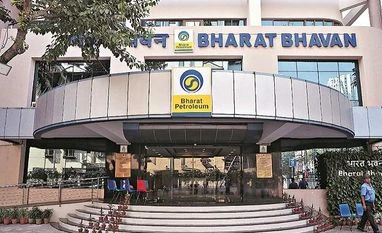
The sale is crucial for the government in order to meet its disinvestment target of Rs 2.1 trillion for the current fiscal. Reliance Industries, however, did not put in a bid, nor did its partner Saudi Aramco. READ MORE
S&P BSE OIL & GAS: A trendline breakout at 17,800 levels indicates a positive outlook. This view is also supported by the upside seen after the stock managed to cross 50-day moving average (DMA), 100-DMA, and 200-DMA efficiently, as per the daily chart. The current support comes in at 100-DMA placed around 12,805 levels. The trend indicates a rally towards the resistance zone of 13,400 to 13,600 levels. The Relative Strength Index (RSI) is successfully trading above the resistance of 58 value indicative of an upward strength. CLICK HERE FOR THE CHART
Bharat Petroleum Corporation Ltd (BPCL): The formation of a “Death Cross” has disrupted the upside bias lately. However, the breakdown did not happen with an acute confirmation.This led to a reversal that managed to cross the resistance of “Death Cross” around Rs 375 levels. As the sentiment appears to be turning positive, the price seems to witness buying momentum on corrective moves. The view holds till the stock trades above Rs 370 levels on the closing basis. The immediate support comes in at Rs 380 levels. One can see a gradual rise in stock towards Rs 440 levels in the coming months. CLICK HERE FOR THE CHART
Hindustan Petroleum Corporation Ltd (HINDPETRO): The stock has struggled to conquer the 50-weekly moving average (WMA) and 100-DMA in July. Now, as it has managed to cross 50-WMA around Rs 211 levels, the optimistic rally may lead towards 100-DMA, currently placed at Rs 234 levels. The sentiment and intensity seem to be in the bulls' favour as the RSI and the Moving Average Convergence Divergence (MACD) made a positive crossover. A closing basis support stands at Rs 200 mark. CLICK HERE FOR THE CHART
Indian Oil Corporation Ltd (IOC): Although, the stock managed to climb above 200-DMA, the follow-up buying seems to neglect the move. If that happens when the RSI is in an overbought condition, then the price may see some profit booking. The stock needs to cross Rs 87 mark with strong volumes to breakout towards Rs 95 and Rs 97 levels. CLICK HERE FOR THE CHART
To read the full story, Subscribe Now at just Rs 249 a month
Already a subscriber? Log in
Subscribe To BS Premium
₹249
Renews automatically
₹1699₹1999
Opt for auto renewal and save Rs. 300 Renews automatically
₹1999
What you get on BS Premium?
-
Unlock 30+ premium stories daily hand-picked by our editors, across devices on browser and app.
-
Pick your 5 favourite companies, get a daily email with all news updates on them.
Full access to our intuitive epaper - clip, save, share articles from any device; newspaper archives from 2006.
Preferential invites to Business Standard events.
Curated newsletters on markets, personal finance, policy & politics, start-ups, technology, and more.
Need More Information - write to us at assist@bsmail.in
)