Don’t miss the latest developments in business and finance.

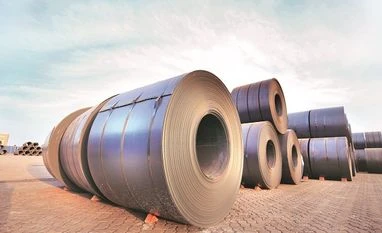
Chart check: US-China trade talks bring metal stocks back in focus

The American and Chinese leaders spoke about their desire to sign an initial trade deal to defuse a 16-month tariff war, boosting financial markets.

.
.
Avdhut Bagkar Mumbai
3 min read Last Updated : Nov 28 2019 | 12:30 PM IST
Metal stocks in Indian markets were in the limelight after US President Donald Trump last week said a trade deal with China is "potentially very close" and that he stands with both Hong Kong’s pro-democracy protesters and Chinese leader Xi Jinping.

The American and Chinese leaders spoke about their desire to sign an initial trade deal to defuse a 16-month tariff war, boosting financial markets. Jinping, who has rarely commented on the trade tensions, said Beijing wants to work out an interim or 'phase one' trade pact but won’t fear retaliating if necessary.

Back home, metal stocks rallied the most earlier this week on hopes of positive developments in US-China trade talks. The Nifty Metal index surged over 3 per cent to 2,599 levels.

Here's how key metal stocks have fared till now.

NIFTY METAL INDEX: The ‘double-bottom’ breakout on the weekly chart has seen the index gain ground in last few sessions. The buying interest was seen around 2,450 levels, which also boosted volumes. The index trades above 50-day moving average (DMA) and 100 DMA located at 2,466 and 2,515 levels. The Moving Average Convergence Divergence (MACD) witnessed a negative crossover since the past few sessions, as per the daily chart. A positive crossover, however, was seen in the weekly chart. CLICK TO VIEW CHART

Tata Steel Ltd (TATASTEEL): A ‘double-bottom’ breakout has resulted in an upside in this counter over the past few sessions towards the Rs-420 mark. The RSI has not entered the overbought region yet, though it has reversed from the 69 value over the past few weeks. The counter has witnessed correction since then and found buying strength again around Rs-380 levels. The 200-DMA is located at Rs-442 levels. A ‘gap-up’ close above Rs 400 triggered an upside in this counter over the past few sessions. CLICK TO VIEW CHART

Vedanta Ltd (VEDL): The weekly formation shows ‘lower high, lower low’ pattern, which witnessed selling pressure on every subsequent rise. The counter, trading below its 200-DMA from May 2018, has not been able to convincingly conquer the significant average. The MACD has also fallen below the signal below. CLICK TO VIEW CHART

Steel Authority of India Ltd (SAIL): The ‘higher high, higher low’ formation on the daily chart has helped the price to cross 100-DMA in the past few weeks. Above Rs 35 levels, the counter has seen the addition of volumes with MACD rising above the signal line. The 200-DMA is located at Rs 44.20 and 100 DMA at 37.70-level. The counter has seen a reversal from recent low of Rs 36. CLICK TO VIEW CHART

JSW Steel Ltd (JSWSTEEL): The stock has crossed its 200-DMA after consolidating in the range of Rs 256 to Rs 242, as per the daily chart. The bigger picture reveals formation of “inverse head and shoulder” pattern in the past few sessions. CLICK TO VIEW CHART

Topics :Metal stocksUS-China trade dealstocks technical analysisTrading strategies

Next Story