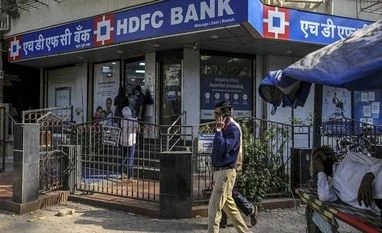
HDFC Bank Limited (HDFCBANK)
Outlook: Consolidation range of Rs 1,550 to Rs 1,450
In April 2021, HDFC Bank saw a breakout from the “Double Bottom” pattern, which saw the stock rise, chart suggests. However, the price action seen since then has not met with follow-up buying. The volumes continue to remain weak volumes and the counter faces selling pressure near Rs 1,550 levels. The overall trend will remain positive as long as the 200-day moving average (DMA) support of Rs 1,430 level is held on a closing basis. The current momentum shows a consolidation range of Rs 1,550 to Rs 1,450 levels. This will be the decisive level to watch in the coming sessions. CLICK HERE FOR THE CHART
Housing Development Finance Corporation Ltd (HDFC)
Likely target: Rs 2,700
Upside potential: 7%
Since the early March 2021, this counter has faced resistance and has been unable to cross Rs 2,700 levels. On the downside, until the support of 200-DMA is held, the stock can attempt rallying towards the above-mentioned resistance. The 200-DMA is placed at Rs 2,436 levels. The Moving Average Convergence Divergence (MACD) is also attempting to cross the zero line; and if that happens, and MACD will show stability. The stock can then regain momentum and move higher. CLICK HERE FOR THE CHART
To read the full story, Subscribe Now at just Rs 249 a month
Already a subscriber? Log in
Subscribe To BS Premium
₹249
Renews automatically
₹1699₹1999
Opt for auto renewal and save Rs. 300 Renews automatically
₹1999
What you get on BS Premium?
-
Unlock 30+ premium stories daily hand-picked by our editors, across devices on browser and app.
-
Pick your 5 favourite companies, get a daily email with all news updates on them.
Full access to our intuitive epaper - clip, save, share articles from any device; newspaper archives from 2006.
Preferential invites to Business Standard events.
Curated newsletters on markets, personal finance, policy & politics, start-ups, technology, and more.
Need More Information - write to us at assist@bsmail.in
)