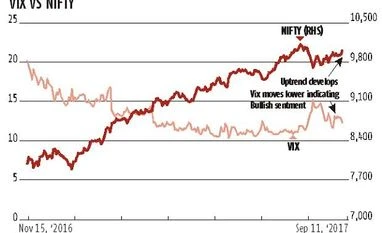
The market might just have executed a breakout after weeks of range trading. The Nifty moved above 10,000 for the first time in over a month and importantly, closed above the five-figure mark. This is a breach of resistance at the 9,975 level.
The Nifty had stayed above the low of 9,685 (August 11) during the range-trading. So, this is a move above a 300-point trading zone. It implies potential upside till around 10,275, which would, of course, mean new highs. The VIX has eased down, backing the bullish move and volumes also look good as foreign portfolio investors (FPIs) bought in quantity. The advance-decline ratio was also very positive, as retail and domestic institutions were also net buyers.
This move suggests the intermediate trend has gone positive. A breakout above 10,137 (the all-time high) would be needed to confirm the big bull market trend. A breakdown below 9,975 would mean a breakout failure and lead to another phase of range-trading.
By definition, the long-term trend is positive. The 200-Day Moving Average (200_DMA) is 9,100, way below the current mark. Taking a longer-term view, the Nifty moved North in late December 2016 from 7,900 levels to a high of 10,137 in early August before it reversed and hit support at 9,685. Another steep correction cannot be absolutely ruled out yet but there will be strong support down till the 9,675 level.
The Nifty Bank had reacted down from an all time high at 25,200 to 23,822 on August 10, before pulling above 24,000 again. The financial index has swung above 24,650 again. It could have a target of 25,000 and if that breaks, we'll probably see a new high.
Two big trending sessions could push the "Bank" till 25,250 and a new high. The financial index is currently held at 24,675. Taking a bullspread with long September 28, 25,000c (118), short September 28, 25,500 (29) costs 90. Another alternative is a calendar spread of long September 28, 25,000c (118) offset by a short September 21, 25,000c (60). The long call will gain proportionately if the short call is struck. The calendar spread may be a better strategy because it's cheaper.
The Nifty PCR is quite bullish at about 1.3 for September-October -November taken together and also for September alone. The September Nifty call chain has peak open interest (OI) at 10,000c, very high OI at 10,100c and 10,200c and high OI until 11,000c. The September put chain has very high OI between 9,700p and 10,000p, with high OI down till 9,000p.
The Nifty closed at 10,006 on Monday. Simple trend following systems are positive again. The current signals suggest buying Nifty with a stop-loss at 9,925. Anybody who sells into the rally should keep a stop at around 10,150.
Option traders must consider the on-the-money straddle of 10,000c (105), 10,000p (81), which costs 186 with breakevens at 10,186, 9,814. This gives an approximation of trader expectations and the asymmetrical premium at 10,000 indicates the bullish sentiment.
A bullspread of long September 10,100c (55) short 10,200c (25) costs 30 and pays a maximum 70. This is about 95 points from money. A bearspread of long September 9,900p (51), short September 9,800p (33) costs 18, pays a maximum of 82 and is about 105 points from the money.
These spreads are near zero-delta and they could be combined. The resulting position costs 48, with breakevens roughly at 9,850, 10,150. One side of this strangle set is near-guaranteed to be hit in the current settlement. Most traders will be looking at long positions however, in the hopes that the breakout will lead to a strong uptrend and new highs.
Unlock 30+ premium stories daily hand-picked by our editors, across devices on browser and app.
Pick your 5 favourite companies, get a daily email with all news updates on them.
Full access to our intuitive epaper - clip, save, share articles from any device; newspaper archives from 2006.
Preferential invites to Business Standard events.
Curated newsletters on markets, personal finance, policy & politics, start-ups, technology, and more.
)