 "BPCL, HPCL, IOC appear bullish on the charts despite a surge in oil prices")
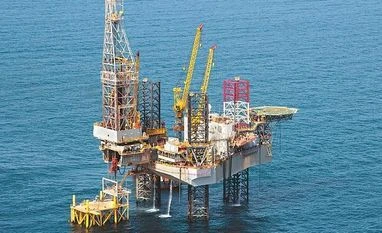
Brent oil prices rallied on Monday, surging past the $70 a barrel mark after the largest-ever disruption of crude production in Saudi Arabia amid drone attacks on its key facilities. The disruption, analysts say, may keep oil prices elevated in the near term.
"Global oil supplies may be adequately met through large inventories and strategic reserves; however, moderation in oil prices will depend on full restoration of Saudi’s production, which may at least take a few weeks. Any further escalation of geopolitical tensions in the middle-east region may add to the woes," said analysts at Kotak Securities in a recent report.
Here's how the stocks of oil marketing companies (OMCs) look on the technical charts:
Nifty Energy Index: The index has been consolidating in the range of 14,730 – 13,750 since August. The formation seems like triple-bottom and a breakout would mean can take the index to the 15,000 mark. The further rally from there can see the index hit 15,400 – 15,500. The trend remains positive, as the index has been constantly trading around breakout levels from the last four sessions. CLICK FOR CHART VIEW
Hindustan Petroleum Corporation Ltd (HINDPETRO): The counter is trading above 200-weekly moving average (WMA), which is currently placed at Rs 230.50. This level did break in October 2018, but failed to do so convincingly. The stock has doubled from its October 2018 low of Rs 155 to hit a 52-week high of Rs 323.30. That said, it is now struggling to cross its 100-days moving average (DMA) at Rs 270. A range of Rs 230 – Rs 270 remains crucial for a further leg-up. If it manages to conquer Rs 270 – Rs 275, then a rally towards Rs 290 and Rs 310 may be possible. CLICK FOR CHART VIEW
Indian Oil Corporation Ltd (IOC): The 50, 100 and 200-day moving averages (DMA) are indicating a negative sentiment. even though the price formation with technical indicators suggest a possible upside. A 'double-bottom' formation supported by the Relative Strength Index (RSI), which is moving up with higher lows after moving out of oversold region, and Moving Average Convergence Divergence (MACD), which is heading towards zero line upward are signs of a possible recovery. A move above Rs 131 may see the counter hit Rs 140 and then 148 in the near-term. There is support of at Rs 120 levels. CLICK FOR CHART VIEW
Bharat Petroleum Corporation Ltd (BPCL): In the last 14 sessions, the counter has outperformed the frontline indices with an up move of 25 per cent. Such a significant rally in a short period may be met with profit booking. The RSI, too, has entered the overbought region. That said, the overall trend remains bullish and a rally towards Rs 440 may be expected. The range of Rs 370 – Rs 365 remains a firm support for the stock. CLICK FOR CHART VIEW
To read the full story, Subscribe Now at just Rs 249 a month
Already a subscriber? Log in
Subscribe To BS Premium
MONTHLY₹9/day
₹249
Renews automatically
SMART ANNUAL₹5/day
₹1699₹1999
Opt for auto renewal and save Rs. 300 Renews automatically
ANNUAL₹6/day
₹1999
What you get on BS Premium?
-
 Unlock 30+ premium stories daily hand-picked by our editors, across devices on browser and app.
 -
 Pick your 5 favourite companies, get a daily email with all news updates on them.
 '%3E%3Cg id='Artboard-Copy' transform='translate(0 0.012)'%3E%3Cg id='_126115' transform='translate(0 0)'%3E%3Cpath id='Path' d='M17.537 1.487a.473.473 0 0 0-.467.477v12.67A2.4 2.4 0 0 1 14.7 17.06H3.3A2.4 2.4 0 0 1 .933 14.634V.966H14.587v12.29a.467.467 0 0 0 .933 0V.489a.473.473 0 0 0-.467-.477H.467A.473.473 0 0 0 0 .489V14.63a3.346 3.346 0 0 0 3.3 3.382H14.7A3.346 3.346 0 0 0 18 14.63V1.965a.467.467 0 0 0-.462-.478Z' transform='translate(0 -0.012)' fill='%23c4132a'%3E%3C/path%3E%3Cpath id='Path-2' d='M12.676 3.955a.478.478 0 1 0 0-.955H2.508a.478.478 0 1 0 0 .955Z' transform='translate(0.124 0.166)' fill='%23c4132a'%3E%3C/path%3E%3Cpath id='Path-3' d='M12.676 13H2.508a.478.478 0 1 0 0 .955H12.672a.478.478 0 1 0 0-.955Z' transform='translate(0.124 0.768)' fill='%23c4132a'%3E%3C/path%3E%3Cpath id='Shape' d='M2 6v5.371a.484.484 0 0 0 .467.5H7.531a.484.484 0 0 0 .467-.5V6a.484.484 0 0 0-.467-.5H2.467A.484.484 0 0 0 2 6Zm.933.5H7.066v4.375H2.933Z' transform='translate(0.122 0.317)' fill='%23c4132a'%3E%3C/path%3E%3Cpath id='Path-4' d='M12.321 5.5H8.967a.478.478 0 1 0 0 .955h3.354a.478.478 0 1 0 0-.955Z' transform='translate(0.517 0.317)' fill='%23c4132a'%3E%3C/path%3E%3Cpath id='Path-5' d='M12.321 8H8.967a.478.478 0 1 0 0 .955h3.354a.478.478 0 1 0 0-.955Z' transform='translate(0.517 0.467)' fill='%23c4132a'%3E%3C/path%3E%3Cpath id='Path-6' d='M12.788 10.977a.473.473 0 0 0-.467-.477H8.967a.478.478 0 1 0 0 .955h3.354a.471.471 0 0 0 .467-.478Z' transform='translate(0.517 0.617)' fill='%23c4132a'%3E%3C/path%3E%3C/g%3E%3C/g%3E%3C/g%3E%3C/svg%3E) Full access to our intuitive epaper - clip, save, share articles from any device; newspaper archives from 2006.
Full access to our intuitive epaper - clip, save, share articles from any device; newspaper archives from 2006. Preferential invites to Business Standard events.
 Curated newsletters on markets, personal finance, policy & politics, start-ups, technology, and more.
Need More Information - write to us at assist@bsmail.in