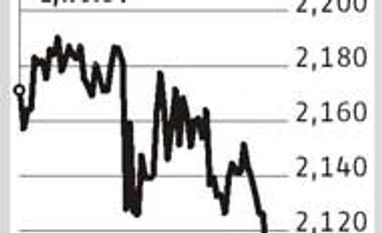
The performance of the S&P 500 Index has signaled the outcome of every presidential election since 1984, according to an analysis by Strategas Research Partners LLC. A gain in the benchmark for American equity in the three months prior to the vote has seen the incumbent party win 86 per cent of the time since 1928. Right now, the benchmark gauge is down 3.6 per cent since August 8, with just a week until the vote, a fact that in isolation augurs well for Donald Trump.
Aside from the three-month interval, the S&P 500 fell Tuesday by the most in three weeks, slipping for a sixth day to 2,111.72, making its first foray below 2,100 since July 7 before rebounding. The gauge is in its longest slide since August 2015 amid polls showing the race for the White House is tightening. The CBOE Volatility Index surged Tuesday by 9 per cent to the highest since June 27.
"People may be saying 'I think Clinton is going to win,' but people are not putting their money to work on the fear of a Brexit like event," said Daniel Clifton, head of policy research at Strategas Research Partners. "The range of outcomes has been increasing in recent weeks rather than decreasing."
The reputation of markets in handicapping politics took a beating in June, when stocks around the world soared prior to the UK referendum only to fall the most in five years when voters chose to secede. Just four months removed from that shock, anxiety levels have spiked in the final week of an election season marked by twists. Clinton's once-dominant lead over Republican Donald Trump has withered in polls since news Friday that her e-mails remain a topic of interest to the FBI.
BLOOMBERG
)