Don’t miss the latest developments in business and finance.

A tangerine and orange comparison

UP has a transparent data generation process for reporting positive cases, writes Alok Kumar, Principal Secretary for Medical Education in the UP government

chart
Alok Kumar
4 min read Last Updated : May 25 2021 | 10:32 PM IST
In his article, “UP: Covid outlier or data fudger” published on May 20, Omkar Goswami has concluded: “To please the powers in Lucknow, district authorities started eliminating a large number of Covid positive reports when passing the data to the State.” The basis of this assertion is that UP’s Test Positivity Rate (TPR) is consistently lower than that of Tamil Nadu, Karnataka, Kerala, and Maharashtra. The hypothesis was that TPRs should be similar in all states facing similar levels of pandemic. On the face of it, the explanation seems plausible. The author makes the cardinal error of omitting to note the several confounders. I take only two — the level of urbanisation as well as the testing mode mix used by the state, which might plausibly explain the difference in TPRs across the states much better.

Makeup of these geographies

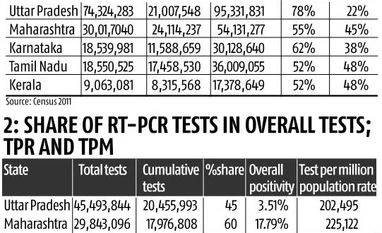
Infectious diseases spread with greater speed in urban areas as compared to rural. Hence we have consistently seen higher TPRs  in urban areas than in rural areas. And UP is by far more rural than any of compared states (see table 1). Among all the states in the comparison, the nearest state in terms of urbanisation is at least 15 percentage points more urban than UP. 


To provide further evidence, I show the daily TPR in percentages (five-day moving average) for three urban districts of Uttar Pradesh: Lucknow (which has 63 per cent urban population), Kanpur Nagar (67 per cent), and Ghaziabad (54 per cent). Around late-April peak of the second wave, RT-PCR TPR in these districts was as high as 35-45 per cent (see graph 1). Not a level of TPR that those allegedly involved in fudging data would be proud to display.

Testing mix

Data on tests suggests that all comparison states — but for Kerala — have a higher share of RT-PCR tests than Uttar Pradesh (see table 2). RT-PCR tests have a higher sensitivity as compared to Rapid Antigen, meaning, on average, they are better in detecting Covid-19 in sample of an infected person. Hence, in expectations, we may see a higher positivity rate in states that have a higher proportion of RT-PCR tests than UP.

To provide further evidence, I show the daily TPR in percentages (five-day moving average) for all tests, antigen tests, and RT-PCR tests in Uttar Pradesh (see graph 2). It clearly shows that UP’s overall peak TPR (5-day moving average) for RT-PCR tests was around 24.68 per cent, whereas the same for Rapid Antigen Tests for the same time was around 9.75 per cent; and hence the TPR for all tests averaged around 17.43 per cent.

It might be argued that UP should not have deployed the level of antigen tests that it does.  And that could be a fair critique of the state’s pandemic response. Scientific rationale suggests, no. In an ongoing pandemic which has an exponential growth, for clinical purposes we may use a test with high analytical sensitivity; however, for effective surveillance and containing the spread of infection, we need a test that is easy to use and allows frequent testing. For these reasons, an article published in the New England Journal of Medicine argues, “the benchmark standard clinical polymerase-chain-reaction (PCR) test fails when used in a surveillance regimen.”

UP has a transparent data generation process for reporting positive cases. Just for the record, the district administration corporations have no influence over reporting of test results for Covid-19. UP’s lab reporting system is decentralised: over 200 labs report results for each individual sample they test on a specially designed portal www.upcovid­­19­tracks.in. Aggregate statistics are then just used an excel tool to sum up unit level data, rather than aggregate numbers provided by the district administration. UP uses this portal to also share the lab reports with its citizens. Anyone who has got tes­ted for Covid-19 can go on this portal and download their report, after verifying an OTP that is sent on their phone number.

When drawing inference from a statistic, a responsible policy maker, researcher, or analyst is expected to account for confounders (factors that can cause or prevent the outcome of interest). However, it is sad to see that despite availability of the urbanisation and test type data in the public domain, these were not used by the author in his analysis. 

The writer is Principal Secretary for Medical Education in the UP government


More From This Section

Disclaimer: These are personal views of the writer. They do not necessarily reflect the opinion of www.business-standard.com or the Business Standard newspaper

Topics :CoronavirusUttar PradeshUttar Pradesh governmentCoronavirus Tests

Next Story