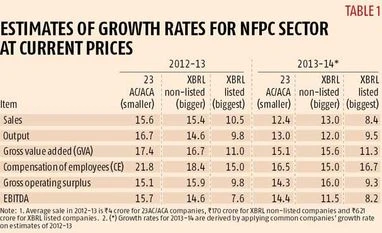
- The MCA21 data is in two formats: all listed companies, companies with paid-up capital of Rs 5 crore and above, or a turnover of Rs 100 crore or above filed under the XBRL (eXtensible Business Reporting Language), a computer language for reporting balance sheet and profit and loss information; the remaining companies report summarised financial information in a simpler e-form termed as 23AC/23ACA.
- The XBRL companies, though less than six per cent of the total active companies which filed accounts in 2011-12, contributed approximately 76 per cent of the total GVA of the NFPC sector.
- Filing of accounts in all cases is a dynamic process. The national accounts estimates released on January 30, use a cut-off date of December 1 for using company data in any particular year. Later filings are accounted for in subsequent revisions. Thus, for 2013-14 the estimates were derived based on growth in about 300,000 common companies between 2013-14 and 2012-13, whereas for 2012-13, the growth rates were obtained by analysing results of 524,000 companies.
- This dynamic character of the data for the purpose of year-on-year comparison requires that the estimates of each year are scaled up to the total base of active companies.
- It is observed that for 23AC/ACA filing companies, which are smaller companies, the GVA growth rates are higher compared to XBRL: listed companies.
- It can be observed that the growth rates of GVA are in ascending order in relation to their relative size (23AC/ACA, XBRL: non-listed, XBRL: listed), that is, smaller companies are growing relatively faster than bigger companies.
- Similarly, the smaller companies have a higher growth in compensation of employees relative to bigger companies.
- A similar trend is observed in the gross OS which includes depreciation also.
It is important to note that apart from public limited and private limited companies (this one is the majority) there are other categories of non-government companies registered with MCA, for example, public unlimited liability company, private unlimited liability company, foreign public limited company etc. The growth rates obtained by Central Statistics Office (CSO) and RBI are different. The lower growth rate in GVA in the RBI study may be due to selectivity bias in the sample and over representation of larger companies.
The major conclusions from above are the following:
(i) Smaller companies have shown higher growth rate in GVA as compared to larger companies.
(ii) Low growth in EBITDA does not necessary result in lower growth of GVA.
(iii) The major reason of difference in growth of GVA and sales and profit is on account of high growth in compensation of employees (or staff cost).
The NFPC sector contributes around 32 per cent of total GVA in the economy in 2011-12. As per the new series (2011-12 series) National Accounts Statistics better captures the contribution to GVA of the smaller companies. This is one of the major reasons for divergence between the growth rates in the new series (2011-12 base year) vis-à-vis the old series (2004-05 base year).
Anindita Sinharay is director, national accounts division, CSO; Ashish Kumar is director general, CSO, & TCA Anant is chief statistician of India
)
