An economist friend was in Brazil in early 1990 when the country was wracked by hyperinflation. The monthly inflation rates were 72 per cent each for January and February and 81 per cent for March. Thus, something costing 100 Brazilian reals on December 31, 1989, became 535 by March 31, 1990. On payday, everyone rushed to buy essential household supplies before prices went up in the next 24 hours. It led to my friend’s observation that hyperinflation made every Brazilian understand exponents.
Any rapidly contagious pandemic goes through a period of exponential proliferation. It follows an elongated S curve. In the early stages, the disease cumulatively grows at a linear pace. Having reached a critical mass, it explodes exponentially — starting with a high rate that later comes down over a larger base of infections. Then it grows linearly for a while, and transits to a logarithmic stage, where it increases at a diminishing rate before finally petering out.
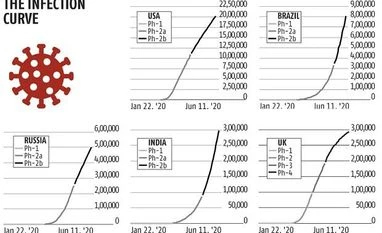
Having a fascination for numbers, I asked myself a simple question: For the five countries worst infected by Covid-19 — the US, Brazil, Russia, India and the UK — what state is the disease in? Still exponential? Or late linear? Or logarithmic? The question is important for it gives clues to how many people could be tested positive.
To understand this, look carefully at the five graphs, representing the number of cumulatively confirmed infections for the five worst off countries. Barring India, the data are from the Johns Hopkins Coronavirus Resource Center (
https://coronavirus.jhu.edu); for India, these are from the Covid19india website (
https://www.covid19india.org). It covers 142 consecutive days, from January 22, 2020, up to June 11, 2020.
Let’s start with the US. For the first 50 days, the disease moved at gentle linear pace to cross 1,000 cases. Then, over the next 50, it galloped at an incredible exponential rate of 12 per cent per day to increase the caseload to 1.1 million. After that, a slower exponential phase took over, where in 42 days it increased at an average daily rate of 1.4 per cent to over 2 million cases. We don’t know how long this slower exponential growth will continue. With the inalienable right of the US citizens to congest beaches during summer, I expect a growth of around 1 per cent per day to last up to Labor Day (September 7). If so, we should be looking at 4.8 million cases by that time. If the growth rate miraculously halves to 0.5 per cent per day from mid-July, there will still be 3.7 million cases. It is a disaster.
Brazil, the second worst, moved 60 days at a linear tempo to cross 1,000 cases. Then the disease took off at 8.2 per cent per day to hit almost 331,000 cases on day 122, after which the growth rate has fallen to 4.5 per cent, which is still alarmingly high. On June 11, Brazil had 802,828 confirmed Covid-19 cases. Like the US, it remains firmly in the exponential zone. And even if the exponent dropped to an average of 2 per cent per day over the next month, the total number of cases would skyrocket to 1.45 million by mid-July.
Russia is also in a dangerous zone. After 66 days of linear growth, which took it past the first 1,000 cases, the disease exploded between day 67 and day 114, growing at 11.1 per cent per day to cross 252,000. Thereafter, the growth rate has slowed to 2.4 per cent per day, with the case load now beyond 500,000. If this lower growth continues for another month, Russia will have over a million cases by mid-July.
Ranked the fourth worst as of now, India has followed a similar pattern. After taking 68 days to cross 1,000 cases, Covid-19 exponented at 8.4 per cent per day to hit almost 86,000 cases. Since then, the growth rate has fallen to 4.6 per cent per day, and we have had over 298,000 confirmed cases up to June 11.
Let us assume that thanks to an increasing base load, this growth rate halves to 2.3 per day. Even in such a scenario, we will have 930,000 confirmed cases by July 31, and over 1.3 million by Independence Day. Given the impossibility of maintaining social distance in urban India, we might end up being the second worst country by early September, worsted only by the US.
Equally, there are countries that are out of the exponential phase and well into the logarithmic zone, where cases are rising at decreasing rates. Only recently, the UK was being ravaged and the Prime Minister was hospitalised. Today, it is in relatively safe harbour. It took the first 53 days to cross 1,000 cases in the UK. Then, over the next 31 days, it hurtled at 14.5 per cent growth per day to approach 95,000 cases. After that linear growth took over for the next 20 days with the cumulative case load rising to almost 192,000. Now it is in the logarithmic phase — where it has taken 38 days for the caseload to reach around 293,000.
The UK isn’t unique. Italy, Spain, France, Germany, the Netherlands, South Korea and Switzerland have successfully flattened the curve, thanks to rigorous social distancing, ubiquitous use of masks, soaps and sanitisers, and the fact wealthy nations can afford to maintain distance. In that context, I fear for India. Not for us lucky ones who contribute to or read this newspaper. But for the many millions who don’t.
The author is chairman, CERG Advisory P Ltd
Unlock 30+ premium stories daily hand-picked by our editors, across devices on browser and app.
Pick your 5 favourite companies, get a daily email with all news updates on them.
Full access to our intuitive epaper - clip, save, share articles from any device; newspaper archives from 2006.
Preferential invites to Business Standard events.
Curated newsletters on markets, personal finance, policy & politics, start-ups, technology, and more.
)