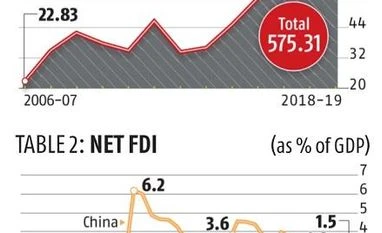
To put this achievement in perspective, it may be useful to notice that according to UNCTAD (World Investment Report) data, India is now the 10th largest recipient of FDI flows, with the US being the leader having attracted $252 billion in 2018. India’s share in global cross-border investment flows has increased from 2.0 per cent in 2010 to 3.2 per cent in 2018.
It is, however, also worth noting, that according to the World Bank data (World Development Indicators), the share of net FDI inflows in India’s GDP has less than halved over the years. It had peaked in 1999 at 3.6 per cent of GDP and has since declined to come in at 1.6 per cent in 2017 (Figure 1). Having staged a comeback in 2018-19, the share would be slightly higher today. In terms of share in GDP, India’s performance looks comparable in 2017 to both China and the US. However, this disguises the reality that with its GDP now nearly five times the size of India’s economy, China managed to attract, $129 billion in 2018 (latest available data). Moreover, it is clear that the remarkable Chinese economic performance since 1982, when it implemented its bold structural reforms, was driven by a relentless pursuit of FDI. Consequently, the share of net FDI inflows in Chinese GDP rose from about a measly 0.2 per cent in 1982 to a whopping 6.2 per cent in 1993. During this time per capita incomes in China rose from $203 to $377 and have maintained this rising trajectory ever since.
In our case, being negligible in 1982, net FDI inflows as a percentage of GDP also increased but peaked in 2008. At its peak, FDI’s share in India’s GDP was just more than half of Chinese peak levels. They were at about the same level in 1982. It is evident that we decided to reduce our dependence on foreign investors for creating additional jobs and spurring economic growth at a much earlier stage compared to our northern neighbour. In this context, it is perhaps worth pointing out here, that in 1991, per capita incomes in China and India were at somewhat similar levels (6-7 per cent) of global average per capita incomes. By 2018, Chinese per capita incomes were more than 85 per cent of global averages, while India’s per capita incomes reached up to 18 per cent of the global averages over this period. Surely, there are some lessons to be learnt from this evidence.
Yet, another feature of FDI inflows into India needs to be recognised. The total gross FDI inflows include both greenfield inflows that create new capacity and employment and brownfield inflows that go towards acquisition of existing assets. Readers would be familiar with examples of recent brownfield FDI inflows as in the case of Walmart’s investment of $16 billion in Flipkart; Gazprom’s takeover of Essar refinery for $12.9 billion; GTL Infrastructure’s takeover of Reliance communications for $10.8 billion. A total of 25 such deals, for which data was collected from EMIS, shows a total of $166 billion having been used for brownfield investments since 2007-08. This is surely an under-estimate. UNCTAD data Ibid. Annex tables show that the value of announced greenfield FDI investment between 2008 and 2018 totalled $255 billion. Thus, the inflow of brownfield FDI during this period was around $262 billion. Actual FDI inflow is significantly lower than the projected figure.
The somewhat strange and inexplicable aspect is that data that clearly distinguishes between the two types of FDI inflows, is just not available from domestic sources, whether private or official. This gap has to be rectified to make FDI data similar to the availability of data on foreign portfolio inflows, which are used for acquiring equity stakes in Indian enterprises from the secondary markets.
It is nobody’s case that FDI inflows need to be given a special treatment over that extended to domestic investors. Our situation is vastly different from China’s which was denuded of entrepreneurial talent and investible resources after three decades of draconian socialist expropriation of private wealth and the excesses of Cultural Revolution. We have always had a thriving entrepreneurial community, which has access to domestic investible pool, generated principally by domestic household savings. FDI finances hardly account for 5 per cent of our total investment.
We have to now discuss as widely and as passionately as possible, the relative merits and demerits of pursuing a policy that seeks to attract greenfield FDI inflows. A clear and consistent position has to be evolved, which brings all stakeholders on the same page. This will ensure that there is policy certainty and greater predictability at all levels towards FDI. In this debate we would also need to distinguish between “tariff jumping” versus “export oriented” FDI. In the vast literature available on this issue, the latter is seen to have significantly more positive economy wide impact than the former. In our effort to take the Indian economy to $5 trillion, such clarity and a unified and predictable policy will surely help.
The writer is Vice Chairman, NITI Aayog. Views are personal
To read the full story, Subscribe Now at just Rs 249 a month
Already a subscriber? Log in
Subscribe To BS Premium
₹249
Renews automatically
₹1699₹1999
Opt for auto renewal and save Rs. 300 Renews automatically
₹1999
What you get on BS Premium?
-
Unlock 30+ premium stories daily hand-picked by our editors, across devices on browser and app.
-
Pick your 5 favourite companies, get a daily email with all news updates on them.
Full access to our intuitive epaper - clip, save, share articles from any device; newspaper archives from 2006.
Preferential invites to Business Standard events.
Curated newsletters on markets, personal finance, policy & politics, start-ups, technology, and more.
Need More Information - write to us at assist@bsmail.in
)