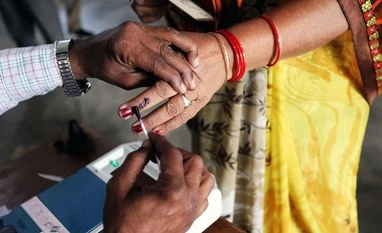
In the 2019 Lok Sabha (LS) polls, 1.06 per cent voters pressed the NOTA button, choosing None Of The Above . This was down from 1.08 per cent in the 2014 LS polls.
A statewise look at the data shows that in 2019, Bihar recorded the highest percentage of NOTA vote share of 2.0 per cent, followed by Andhra Pradesh (1.54 per cent), and Chhattisgarh (1.44 per cent). Among Union Territories (UTs), Daman and Diu topped the NOTA vote percentage at 1.70 per cent. A total of 6.52 million NOTA votes were polled in the 2019 LS polls, of which 22,272 votes were postal ballots. In 2014, Meghalaya (2.80 per cent) polled the maximum NOTA votes, followed by Chhattisgarh (1.83 per cent), and Gujarat (1.76 per cent). Among UTs, Puducherry recorded the highest percentage at 3.01 per cent. In 2014, NOTA secured 6.02 million votes.
The provision for NOTA was made for the first time during Assembly polls to Chhattisgarh, Madhya Pradesh, Mizoram, Delhi and Rajasthan in December 2013. Since then, it has featured in all Assembly and Lok Sabha polls.
Top 10 constituencies with highest percentage of NOTA votes polled over total votes in the 2019 and 2014 Lok Sabha polls:
| LS constituency with highest percentage of NOTA votes in 2019 | % of votes to NOTA out of total votes polled in 2019 LS | LS constituency with highest percentage of NOTA votes in 2014 | % of votes to NOTA out of total votes polled in 2014 LS |
| Gopalganj (Bihar) | 5.034 | Bastar (Chhattisgarh) | 5.04 |
| Bastar (Chhattisgarh) | 4.559 | Nilgiris (Tamil Nadu) | 4.99 |
| Paschim Champaran (Bihar) | 4.509 | Nabarangpur (Odisha) | 4.34 |
| Aruku (Andhra Pradesh) | 4.449 | Tura (Meghalaya) | 4.19 |
| Jamui (Bihar) | 4.159 | Dahod (Gujarat) | 3.58 |
| Nabarangpur (Odisha) | 3.837 | Singhbhum (Jharkhand) | 3.5 |
| Nawada (Bihar) | 3.72 | Samastipur (Bihar) | 3.38 |
| Samastipur (Bihar) | 3.473 | Koraput (Odisha) | 3.35 |
| Koraput (Odisha) | 3.383 | Khunti (Jharkhand) | 3.23 |
| Jahanabad (Bihar) | 3.366 | Kanker (Chhattisgarh) | 3.14 |
Sources: ECI, ADR and media reports
)