With its rich experience in offshore services and an enviable talent pool to boot, India is one of the most sought-after offshoring destinations. As international firms are focusing on lowering costs, there has been a flow of offshoring, especially of non-critical roles,to low-cost nations.
According to US-based Hackett Group Inc, North American and European companies will move 750,000 jobs in IT, finance and other business services to India and other low-cost nations by 2016.
Here is a SWOT analysis of India:
Strengths
. Skilled workforce and huge talent pool (4.4 mn graduates and postgraduates join the workforce annually)
. Specialised labour pool from existing KPOs (India was the first to enter the outsourcing and offshoring market)
. Favourable and supportive policies for offshoring
. Larger English-speaking workforce, compared to other offshore destinations
____________________________________
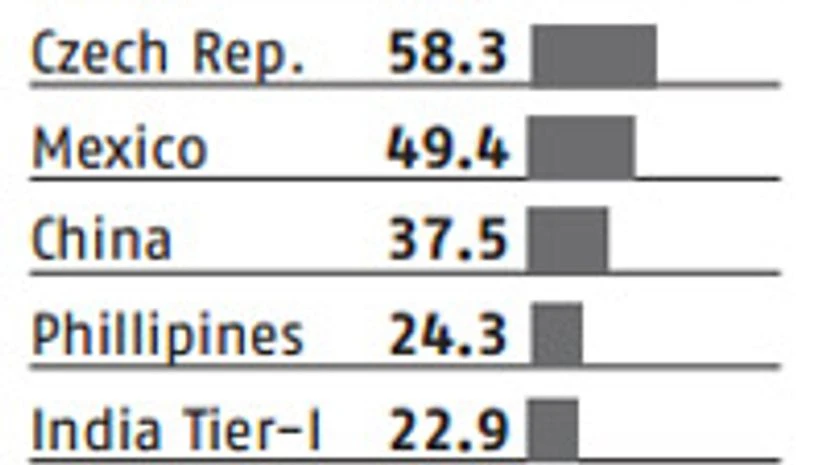
Graphics | New business services jobs moving to low-cost geographies, 2012 - 16 (%)
____________________________________
 ____________________________________
____________________________________
Graphics | New business services jobs moving to low-cost geographies, 2012 - 16 (%)
____________________________________

More From This Section
Weaknesses
. Time-zone difference with the US
. Focusing on developing infrastructure in tier-II cities, but experienced talent pool is not ready to move there
. Tier-II cities lack in skill availability at mid- and senior-level management
____________________________________
 Graphics | Countries preferred by various organisations for offshore finance functions
____________________________________

__________________________________________________________________________
Opportunities
. Tier-II cities are one of the most cost-effective destinations in the world
. Increase in workforce and talent pool in tier-II cities
 _____________________________
Graphics | India's talent pool FY12 (%) (total 4.4 million)
_____________________________
__________________________________________________________________________
Graphics | India's talent pool FY12 (%) (total 4.4 million)
_____________________________
Threats
. Rising operating costs in tier-I cities (salary increase and rise in rentals)
. Competition from new offshoring locations such as China and the Philippines

_____________________________
Graphics | Operating cost per FTE for transactional KPO services, 2011 ($ ‘000) (per annum)
_____________________________
 _____________________________
Graphics | Operating cost per FTE for IT services, 2011 ($ ‘000) (per annum)
_____________________________

_____________________________
Graphics | Operating cost per FTE for transactional KPO services, 2011 ($ ‘000) (per annum)
_____________________________
 _____________________________
Graphics | Operating cost per FTE for IT services, 2011 ($ ‘000) (per annum)
_____________________________


)
