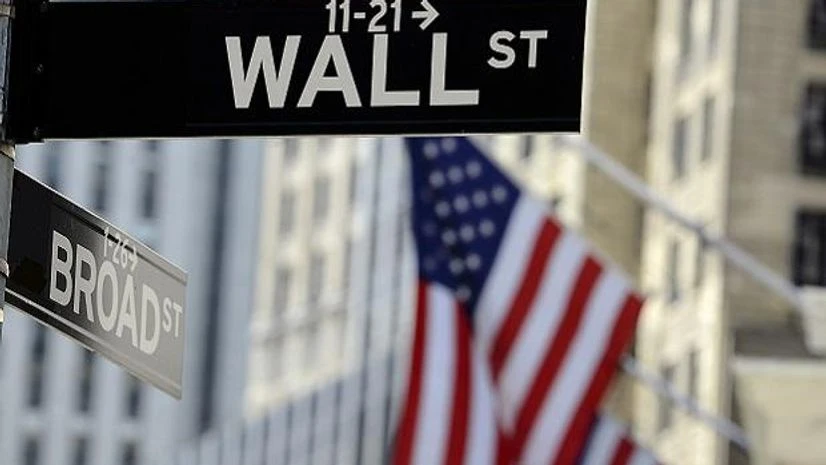
Welcome to the worst month of the year for Wall Street. Since 1950, September has brought an average loss of 0.5 per cent for the S and P 500. That's 10 times worse than the next-worst month, February.
September is also the only month of the year over that span to turn in a loss more often than a gain. Other months see the S and P 500 rise more than three times out of five.
Stretch the horizon even further, back to 1928 to include a world war, the Great Depression and completely different types of economies, and September is still the most frequent stinker for Wall Street.
No clear reason explains September's struggle, though many hypotheses try. One suggests the return of many professional investors from summer vacations may add to the selling pressure, for example.
Last year, the S and P 500 fell 4.8 per cent in September for its first loss in eight months. At the time, worries were brewing about when the Federal Reserve would take its foot off the economic stimulus accelerator.
It's not always so. Two years earlier, a solid September gain helped to virtually reverse an August swoon.
More From This Section
And in 2010, when the economy was climbing back from the Great Recession, September was the best month of the year for stocks.
This year's September has plenty of big events circled on the calendar that could yield more big swings for a market that's already been beset by them. Chief among them is the Federal Reserve's meeting on interest-rate policy September 20-21.
It's almost certain to raise its benchmark short-term rate for the fifth time this year. The only question is by how much.
Several reports on the economy before that crucial meeting could alter the Fed's thinking ahead that meeting, including August hiring data due Friday and a report on inflation due September 13.
(Only the headline and picture of this report may have been reworked by the Business Standard staff; the rest of the content is auto-generated from a syndicated feed.)

)
