The Income Tax Department's (ITD's) new tax statistics may be classified into two categories, macro economy and micro taxpayer levels. Accordingly I will analyse them in two parts, today's being macro, for 2000-01 to 2014-15. Reported 2015-16 numbers are provisional or incomplete. The GDP series used by ITD coincides with the Reserve Bank of India (RBI) series except for the initial four years.
Conclusions from the statistics are a mix of bad and good: (1) growth in tax buoyancy (percentage response in tax revenue to one per cent increase in GDP) is not too impressive; (2) initial gain in direct tax collection has been challenged by indirect tax and the difference is closing; (3) pendency in completing assessment of taxpayers by the tax administration has relatively improved; (4) ITD has suffered severe relative decline in its own budget; and (5) the number of assesses has grown.

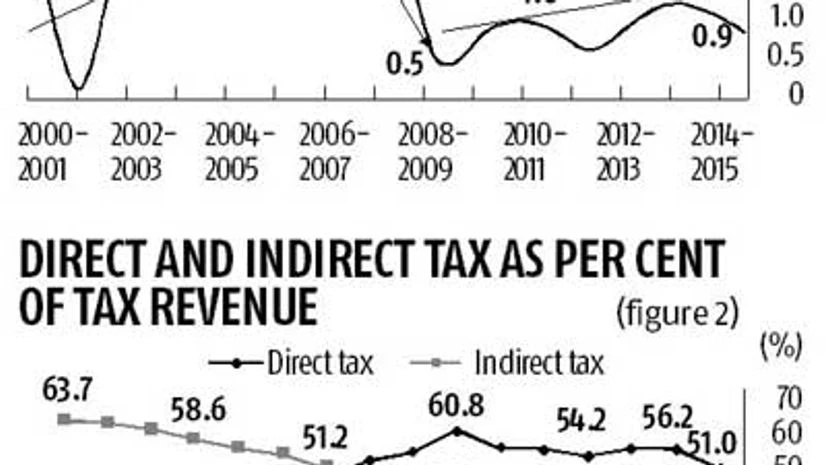
First, Figure 1 plots annual buoyancy of the tax system and shows its changes (arrows). Buoyancy crashed in 2008-09 and 2009-10 reflecting the loosening of taxation after the 2008 global crisis. I have maintained it was needed to the extent needed since India was not severely exposed to the crisis. Now looking forward, what policy mix would move the buoyancy upward from the steady state at which it appears to be languishing? Obviously more tax incentives will not help while base broadening would. Accordingly, the Finance Minister's last Budget thrust would need to be redirected in the next.
Second, Figure 2 demonstrates a scissors pattern with direct tax steadily gaining and then overtaking indirect tax in share of total revenue from 2007-08 but, after achieving the highest difference in 2009-10, the gap has been narrowing. An indicator of development is higher dependence on direct tax over time reflecting less dependence on distortionary customs duties and domestic excise taxes. That gain has been eroding in the case of India. Some explanations may be given. (i) Rate of growth of private final consumption has been higher than rate of GDP growth so that tax collection rate from the former base may be expected to be higher than from the latter. (ii) Service tax rate has been increasing. (iii) Robust petroleum revenue is protected if its revenue per litre is maintained even as its international price per litre declines.

Third is the issue of assessing officers' workload. This is the sum of last year's undisposed assessment cases plus current year's new cases. ITD's Table 1.8 (not reproduced here) reports data on: (1) year-beginning workload or "total" cases; and (2) year-end disposed cases. We converted this to: (3) undisposed cases; and (4) year-beginning "new" cases, as follows. For 2013-14, (1) is 30,456,681 and (2) is 19,924,496. Thus, the difference, (3) 10,532,185, is undisposed cases which are carried forward to 2014-15. Thus, the new cases for 2014-15 must be (4) 21,254,217, which is the difference between carried forward cases (3) for 2013-14 and total cases (1) for 2014-15 (reported in Table 1.8 as 31,786,402). We repeated the exercise for all years.

These calculations enabled Figure 3 which plots: (i) carried forward cases over total workload, and (ii) carried forward cases over new cases. From 2011-12, both trends have declined i.e. indicators have improved, revealing relatively less cases remain incomplete. Further, from ITD's Table 1.8, it is obvious that workload had increased in 2008-09 to 2010-11 and, correspondingly, disposal had also shown improvement. This was possible through the new Computerized Processing Centre (CPC) in Bengaluru. It is hoped that the positive trend is not reversed from 2014-15; and it is also true that pendency in nominal terms needs to be brought down even further.
Fourth, is it fair to expect too much improvement given the cutback in resources given to ITD, declining from 1.36 per cent in proportion of tax collection in 2000-01 to 0.59 per cent in 2014-15, among the lowest in the world? Adverse ramifications of this continues in quantitative (revenue) and qualitative (moral hazard) terms. Policy correction is warranted without which modernisation of tax administration is impossible. Another urgent policy correction is needed: rationalise assessment selection by cutting out routine assessment and enhancing efficiency of completing selected cases, which was an important Tax Administration Reform Commission (TARC) 2015 recommendation.
Fifth, as our Table 1 reveals, the number of assesses has grown by almost 20 per cent from 2011-12 to 2013-14. ITD's "effective assessees" concept includes income tax returns plus those subject to tax deduction at source (TDS) but have not filed returns. It is a useful indicator, but it does not necessarily mean all of them actually paid tax. The effort to increase the numerical base needs to be intensified so that the burden on those who are already paying tax is alleviated, is another recommendation of TARC.
Hopefully ITD will continue publication and researchers will respond by using it intensively.
Disclaimer: These are personal views of the writer. They do not necessarily reflect the opinion of www.business-standard.com or the Business Standard newspaper

)
