 "chart")
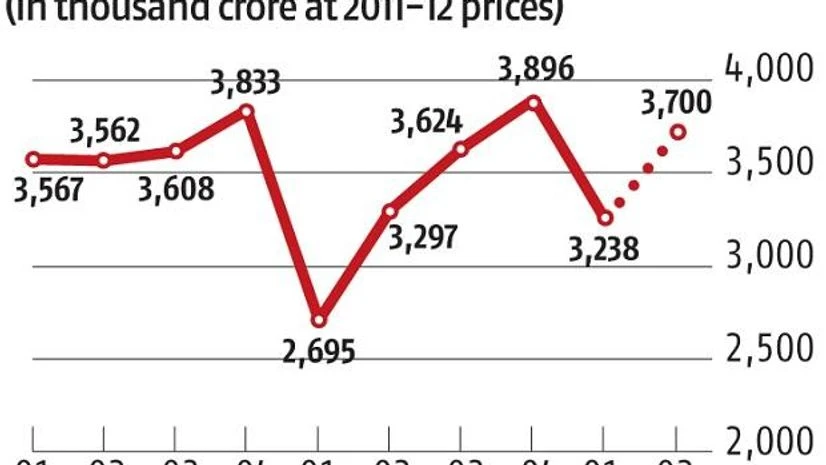
Ever since the National Statistical Office (NSO) estimates of 2021-22 Q1 came out at end August, there has been a lively debate on whether it reflects a V-shaped recovery or not. Well, a glance at the figure should answer the question. It plots the level of real (inflation-adjusted) quarterly GDP as per the NSO since the first quarter of 2019-20 and includes my guestimate for 2021-22 Q2. It clearly supports three statements. First, the recovery from the deep plunge of April-June 2020 (the brutal downswing of the “V”) was followed by a smart recovery in the next three quarters to
Disclaimer: These are personal views of the writer. They do not necessarily reflect the opinion of www.business-standard.com or the Business Standard newspaper
 Unlock 30+ premium stories daily hand-picked by our editors, across devices on browser and app.
 Pick your 5 favourite companies, get a daily email with all news updates on them.
'%3E%3Cg id='Artboard-Copy' transform='translate(0 0.012)'%3E%3Cg id='_126115' transform='translate(0 0)'%3E%3Cpath id='Path' d='M17.537 1.487a.473.473 0 0 0-.467.477v12.67A2.4 2.4 0 0 1 14.7 17.06H3.3A2.4 2.4 0 0 1 .933 14.634V.966H14.587v12.29a.467.467 0 0 0 .933 0V.489a.473.473 0 0 0-.467-.477H.467A.473.473 0 0 0 0 .489V14.63a3.346 3.346 0 0 0 3.3 3.382H14.7A3.346 3.346 0 0 0 18 14.63V1.965a.467.467 0 0 0-.462-.478Z' transform='translate(0 -0.012)' fill='%23c4132a'%3E%3C/path%3E%3Cpath id='Path-2' d='M12.676 3.955a.478.478 0 1 0 0-.955H2.508a.478.478 0 1 0 0 .955Z' transform='translate(0.124 0.166)' fill='%23c4132a'%3E%3C/path%3E%3Cpath id='Path-3' d='M12.676 13H2.508a.478.478 0 1 0 0 .955H12.672a.478.478 0 1 0 0-.955Z' transform='translate(0.124 0.768)' fill='%23c4132a'%3E%3C/path%3E%3Cpath id='Shape' d='M2 6v5.371a.484.484 0 0 0 .467.5H7.531a.484.484 0 0 0 .467-.5V6a.484.484 0 0 0-.467-.5H2.467A.484.484 0 0 0 2 6Zm.933.5H7.066v4.375H2.933Z' transform='translate(0.122 0.317)' fill='%23c4132a'%3E%3C/path%3E%3Cpath id='Path-4' d='M12.321 5.5H8.967a.478.478 0 1 0 0 .955h3.354a.478.478 0 1 0 0-.955Z' transform='translate(0.517 0.317)' fill='%23c4132a'%3E%3C/path%3E%3Cpath id='Path-5' d='M12.321 8H8.967a.478.478 0 1 0 0 .955h3.354a.478.478 0 1 0 0-.955Z' transform='translate(0.517 0.467)' fill='%23c4132a'%3E%3C/path%3E%3Cpath id='Path-6' d='M12.788 10.977a.473.473 0 0 0-.467-.477H8.967a.478.478 0 1 0 0 .955h3.354a.471.471 0 0 0 .467-.478Z' transform='translate(0.517 0.617)' fill='%23c4132a'%3E%3C/path%3E%3C/g%3E%3C/g%3E%3C/g%3E%3C/svg%3E) Full access to our intuitive epaper - clip, save, share articles from any device; newspaper archives from 2006.
Full access to our intuitive epaper - clip, save, share articles from any device; newspaper archives from 2006. Preferential invites to Business Standard events.
 Curated newsletters on markets, personal finance, policy & politics, start-ups, technology, and more.