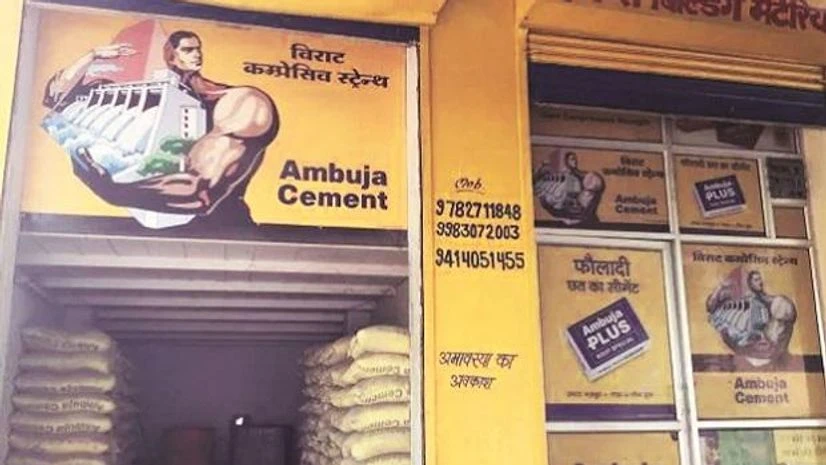
Shares of cement companies were in limelight on Tuesday after Adani Group-owned Ambuja Cements entered into an agreement to acquire 46.8 per cent stake in Orient Cement for Rs 8,100 crore.
Ambuja Cement will make an open offer to acquire additional stake at Rs 395.40 per share. This is the third major acquisition by the Adani Group firm in the cement sector following Sanghi Cement and Penna Cement.
Ambuja Cement piped UltraTech Cement who alongside JSW was also in the race to acquire CK Birla-owned Orient Cement.
At 10:45 AM, on the bourses, Ambuja Cements stock traded with a loss of 1.5 per cent at Rs 563, while Orient Cement share price was down 1 per cent at Rs 349.
Meanwhile, UltraTech Cement stock slipped 0.6 per cent to Rs 10,800. UltraTech yesterday reported a 36 per cent year-on-year (YoY) fall in net profit for Q2FY25 at Rs 820 crore, on account of lower revenue from operations. Total revenue declined by 2.4 per cent YoY to Rs 15,634.73 crore.
Against this background, here's a technical outlook on key stocks from the cement sector:
More From This Section
Ambuja Cements
Current Price: 563
Downside Risk: 9.4%
Support: Rs 542
Resistance: Rs 596; Rs 614; Rs 637
Ambuja Cements stock has been trending lower since the downside breakout in early August. The stock seems on course to test its super trend line support at Rs 542 on the weekly scale; below which a dip towards the 100-WMA (Weekly Moving Average) at Rs 510 seems likely.
The near-term bias is likely to remain negative as long as the stock trades below Rs 596; above which the key hurdle stands at Rs 637. The daily chart shows that Ambuja Cement is on the verge of seeing a 'Death Cross' formation as the 50-DMA (Daily Moving Average) at Rs 615 is seen sliding below the 200-DMA at Rs 614. CLICK HERE FOR THE CHART
UltraTech Cement
Current Price: Rs 10,800
Downside Risk: 12%
Support: Rs 10,600; Rs 10,390
Resistance: Rs 11,330
UltraTech Cement stock is seen trading below the 20-, 50- and 100-DMA for the last three trading sessions. The stock is now within striking distance of testing the 200-DMA support at Rs 10,560. The 200-DMA coincides with the super trend line support at Rs 10,600 on the weekly scale.
Thus, this particular support holds the key for the future trend for UltraTech Cement. In case, this support is broken, there stands a minor support at Rs 10,390; below which a sharp fall towards Rs 9,500 seems likely.
On the upside, the stock needs to cross and sustain above the 100-DMA, which stands at Rs 11,330 levels for the sentiment to revive at the counter. CLICK HERE FOR THE CHART
Current Price: Rs 4,188
Downside Risk: 5.7%
Support: Rs 4,175
Resistance: Rs 4,390
JK Cement stock is seen trading below its 200-DMA for the second straight day. More importantly, the stock is seen seeking support around the 50-WMA at Rs 4,175 - a key moving average the stock has held since November 2022.
Chart shows that below Rs 4,175, JK Cement stock can dip to Rs 3,950 levels. On the upside, the stock needs to break and trade above Rs 4,390 for the sentiment to be revived. CLICK HERE FOR THE CHART
Mangalam Cement
Current Price: Rs 113
Downside Risk: 15%
Support: Rs 111; Rs 109
Resistance: Rs 126
Mangalam Cement stock is seen trading within striking distance of the 200-DMA, which stands at Rs 111. Off late, the stock has been making lower highs and lower lows thus indicating a likely bearish trend as long as the stock trades below Rs 126.
On the downside, the 200-DMA support coincides with the 50- and 100-WMA; thus suggesting presence of multiple supports in the Rs 109 - Rs 111 range. Further, given the oversold condition, a pullback from these support levels cannot be ruled out. Meanwhile, long-term chart suggests that a break of the support levels can trigger a slide towards Rs 96 levels. CLICK HERE FOR THE CHART
HeidelbergCement India
Current Price: Rs 225
Upside Potential: 12%
Support: Rs 223; Rs 219
Resistance: Rs 233; Rs 245
HeidelbergCement stock has been buzzing in trades amid talks of a likely stake sale. On the chart, the stock has given a positive breakout last week, and thereafter is seen consolidating. At present, the stock is seen seeking support at its 50-DMA at Rs 223; below which the 100-DMA support stands at Rs 219.
As long as these support levels are protected the stock is likely to trade with a positive bias. On the upside, the stock can rally to Rs 252 with interim resistance likely around Rs 233 and Rs 245 levels. CLICK HERE FOR THE CHART

)