Nifty Financial Services
Last close: 17,616.05
Last close: 17,616.05
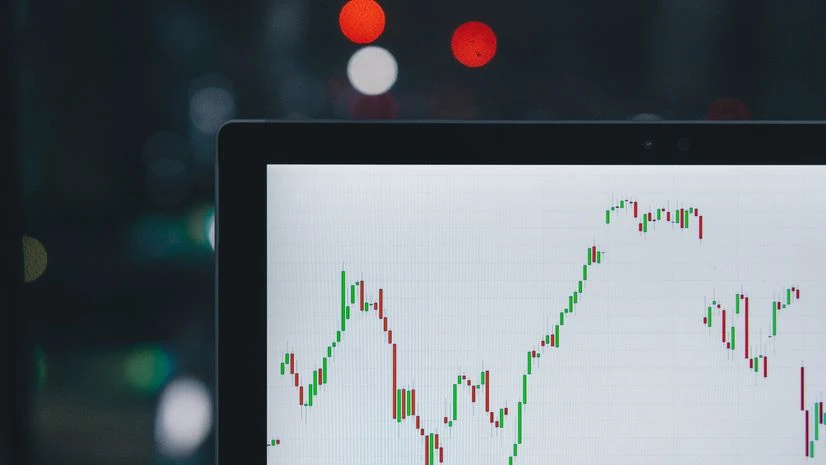
Charts suggest that the index is undergoing a downtrend in the near term. The expected targets have been identified at 17,410 and 17,360.
According to technical indicators such as the Moving Average Convergence Divergence (MACD), a downward trend is evidenced, with the signal line existing below zero and the histogram portraying that selling will ensue during rallies.
It is imperative that the index must conclude above 17,725, which represents the 20-day moving average, prior to any trend shift.
Therefore, the most prudent strategy for traders would be to sell on an increase in price with a view to achieving the above-noted targets, while implementing a stop loss.
In conclusion, it is advisable that traders should adopt a sell-on-rise strategy with their eyes set on targets at 17,410 and 17,360, while taking due care to manage risks and safeguard their investments in light of the current downward trend.
Intraday no trade zone: 17,664 - 17,581
Intraday Resistance Levels: 17,716 - 17,800 - 17,950
Intraday Support Levels: 17,536 - 17,410 – 17,336
Nifty Auto
Last close: 12,044.45
Last close: 12,044.45
More From This Section
Charts suggest that the index is likely to experience a technical bounce soon. The minimum target for the bounce, or the first resistance on the charts, is expected to be around 12,236.
Traders should adopt a buy-on-dips strategy, as the index is oversold on hourly charts, according to technical indicators such as the Relative Strength Index (RSI) and stochastic.
As the index is oversold, it may experience a bounce back in the near term. The best trading strategy for traders would be to purchase the index when it dips, as the expected target is 12,236.
Technical indicators such as the RSI and stochastic suggest that the index is oversold, which further supports this trading strategy.
In conclusion, traders should adopt a buy-on-dips approach for the Nifty Auto, with a minimum target of 12,236. With technical indicators suggesting that the index is oversold, a bounceback is likely in the near term.
Intraday no trade zone: 12,000 - 12,064
Intraday Resistance Levels: 12,106 - 12,176 - 12,290
Intraday Support Levels: 11,990 - 11,945 – 11,850
(Ravi Nathani is an independent technical analyst. Views expressed are personal).
(Ravi Nathani is an independent technical analyst. Views expressed are personal).

)
