ALSO READ: Parthasarathi Shome: I-T Department statistics - I
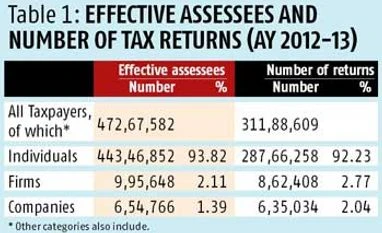
Focussing on returns, for individuals (and a third category, firms), 55-56 per cent of the total number of returns reflect an income range of less than Rs 2 lakh while, for companies, that share is 46 per cent. Nevertheless, as Figure 1 shows, overall, there is significant clustering at lower taxable incomes for all taxpayers filing returns; and, after that, the share of number of returns falls off significantly for all taxpayer categories.
Moving from returns to incomes, however, I-T department tables appear to need further clarification or modification. "Average Tax Payable" for individuals (I-T department Table 2.9) and companies (I-T department Table 6.9) appears too high even though Note 1 of I-T department Table 6.9 explains, "Tax Payable is the aggregate tax liability as computed in the computation of tax liability on total income schedule of return of income. Tax, surcharge, cess & interest after giving credit under section 115JAA and relief under sections 89/90/90A/91 but before giving credit for taxes paid (advance tax/TDS/TCS/self-assessment tax) constitute Tax Payable".
Data on "Sum of Returned Income" (I-T department Table 6.8) appear to be more plausible. However, since Tax Payable (I-T department Table 6.9) is too high, when the ratio of "Sum of Tax Payable" over "Sum of Returned Income" is calculated for companies or individuals, the series is too high (hence not shown). This part of the data thus needs to be revisited or explained. I then excluded loss-making companies (income range less than zero) but again, for remaining companiesin many income ranges, the ratio remains too high (hence not shown).
I-T department data on Average Tax Payable i.e. total tax payable over the number of returns by income range, also needs correction (hence not shown).
Despite data corrections needed, one broad observation that could perhaps be made isthat the lowest income range could account for some 20 per cent of tax payablefor individual returns, five per cent or so for firms, and insignificant for companies(Figure 2). For companies it continues to remain low and appears to increase steeply only after Rs 50 crore. By contrast, middle class individuals falling between Rs 5 lakh and Rs 50 lakh represent an observable rise in their tax payable while, somewhat alarmingly, the share of tax payableby individuals declines rapidly after Rs 5 crore income. Note,however, that I-T department data should be revisited by I-T department for removal of any doubt.
For companies, as indicated above, tax payable is steep only at high corporate incomes. It is possible that high tax falls on the financial sector and MNEs which face a higher corporate tax rate (but no DDT). What is also possible is that domestic capital owners are able to divert individual income not only to lower-taxed dividends but also tocorporate incomeswhose effective rates remain low except for MNEs. Admittedly, this is not yet tested as a hypothesis; it is thus imperative for I-T department to provide correct data such that analysis may be successfully conducted.
Tax distortions continue to represent production constraints. In a 2013-14 World Bank survey of 9,281 private sector Indian enterprises, corruption, tax rates, and tax administration were cited as the first, third and eighth of 15 business environment obstacles (the second was electricity). Further, corruption was on the top for all - small, medium and large - enterprises. Regarding tax rates, obviously as the number of government cesses increases, as the service tax rate has inevitably increased, and as excises and customs duties have been resistant to being brought down to global levels, businesses are suffering from increasing tax rates.
Individual taxreturns currently pass through the centralised processing centre (CPC) faster than before but slowdowns occur; besides, selection of scrutiny cases through computer assisted scrutiny selection (CASS) continues to be erroneous and cases get unnecessarily extended longer than needed. These are matters of grave concern since such practices stand out in contrast to benchmarks achieved in comparable emerging economies. Due to the production constraints they pose, until and unless the I-T department takes serious corrective measures, national goals of make-in-India cannot be achieved.
)